Slack Metric Alerting
This topic describes integrating the KubeSlice metric alerts with Slack. The integration involves configuring the Prometheus rules. The integration helps you receive alerts on issues such as a pod not working on your cluster.
For more information on the metrics description, see KubeSlice Metrics.
Configure Alerts Integration
To integrate KubeSlice alerts with Slack, follow these steps:
-
If you are already using Prometheus in your environment, ensure that you have a namespace dedicated to Prometheus. You can use this existing namespace for the KubeSlice-Prometheus integration. If you don't have an existing Prometheus namespace, continue with the next step.
-
Add the kubeslice-Prometheus repo using the following command:
helm repo add kubeslice/prometheus -
On your Slack workspace, create a channel called
#kubeslice-event-alerts. -
You should get the Slack API URL for Slack-based alerts. To create the Slack API URL on the
#kubeslice-events-alertschannel, click the Settings icon and go to Administration > Manage apps.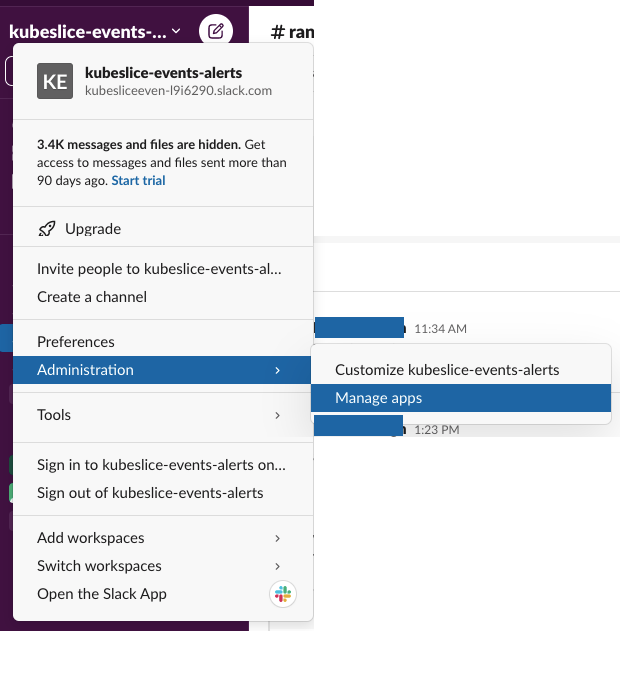
-
On the slack app directory page, go to Installed Apps in the left sidebar.
-
Look for
incoming-webhookin the Search field, and clickincoming-webhookfrom the search results.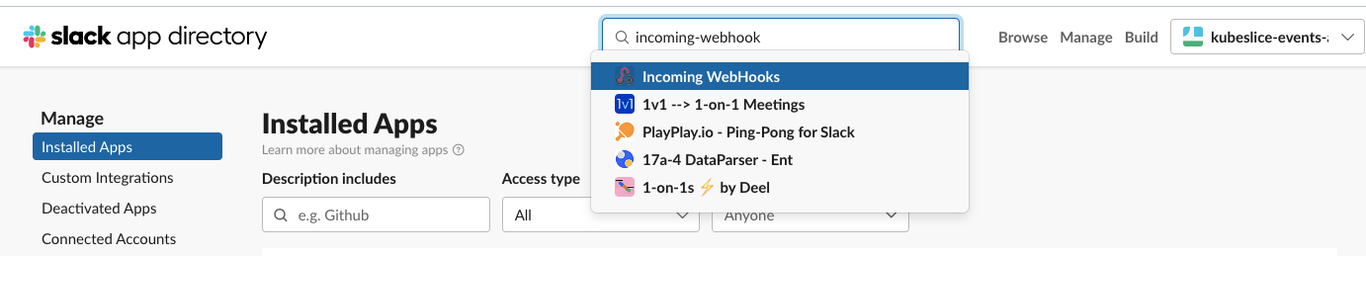
-
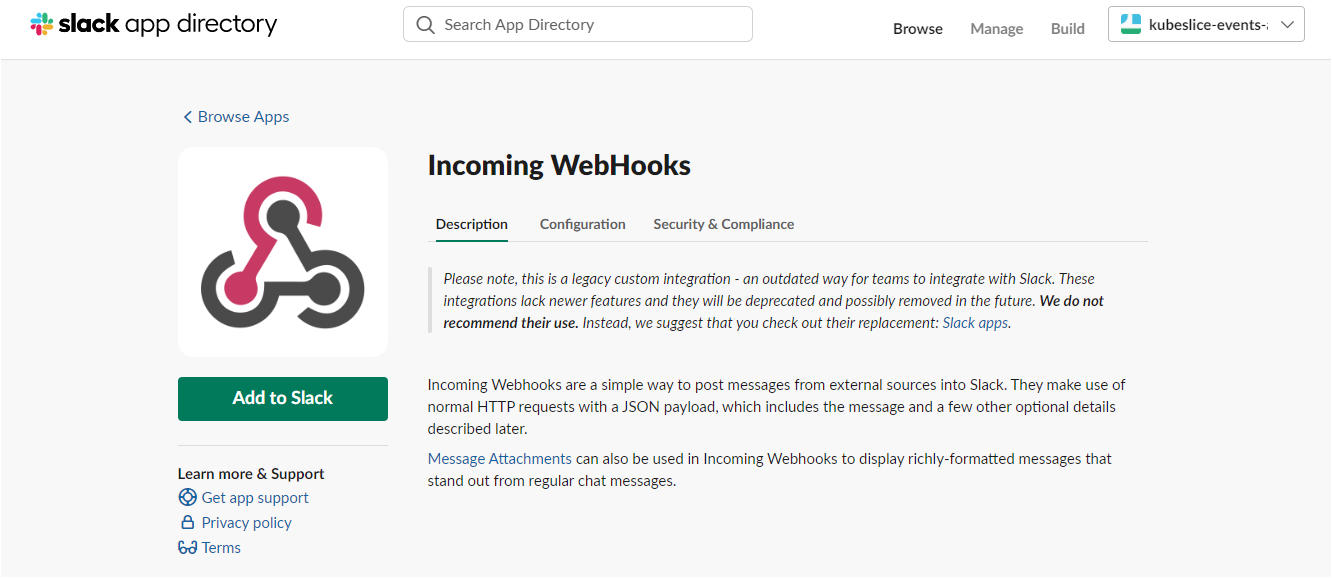
Click Add to Slack to add incoming webhooks.
-
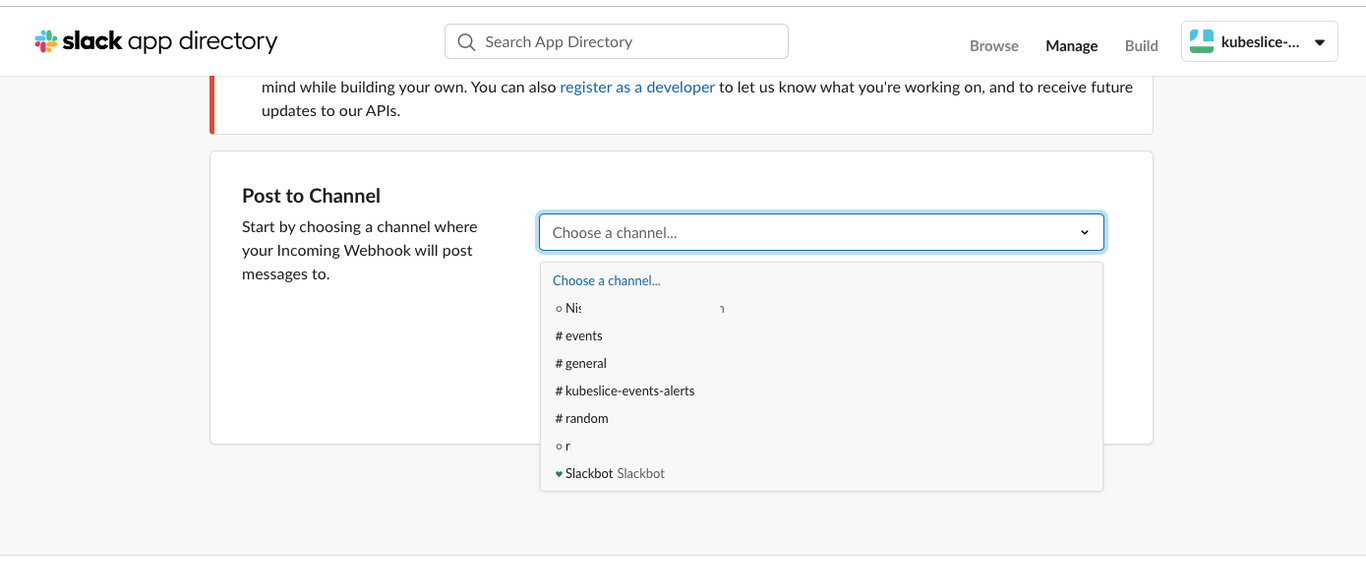
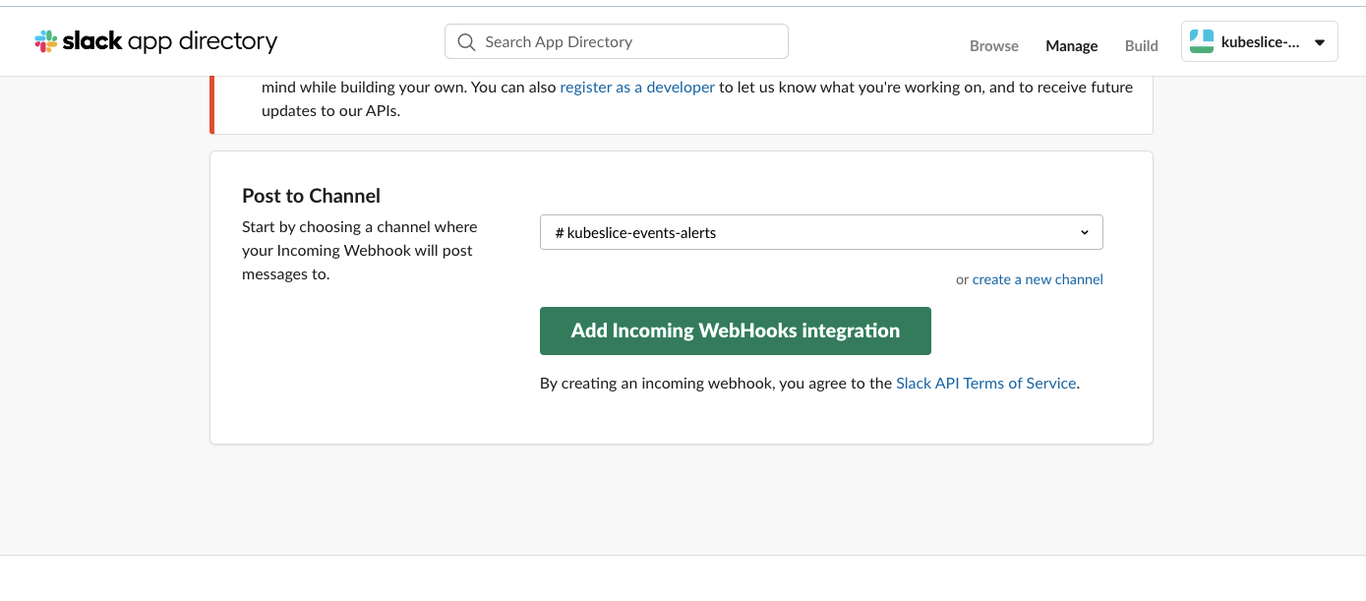
Under Post to Channel, choose kubeslice-events-alerts to post the alerts.
-
Click Add Incoming Webhooks integration.
-
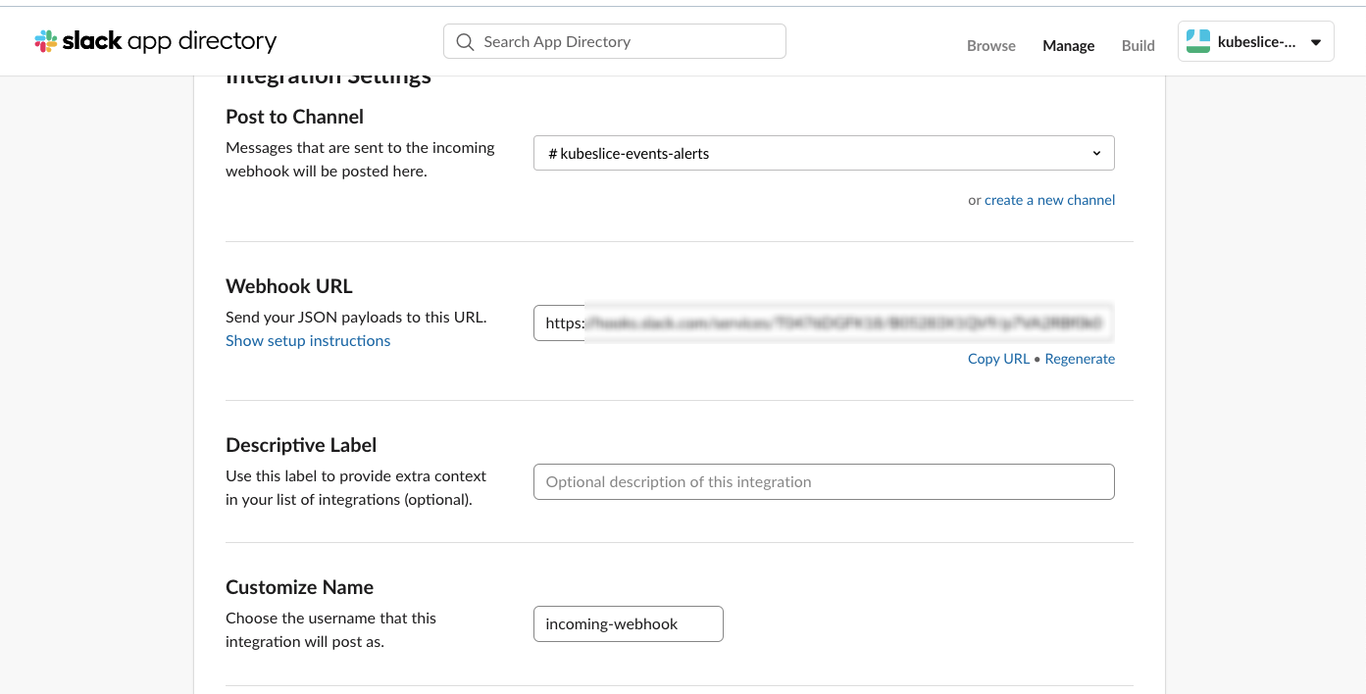
You get a webhook URL that you should copy and note it down in a separate file for using it later.
-
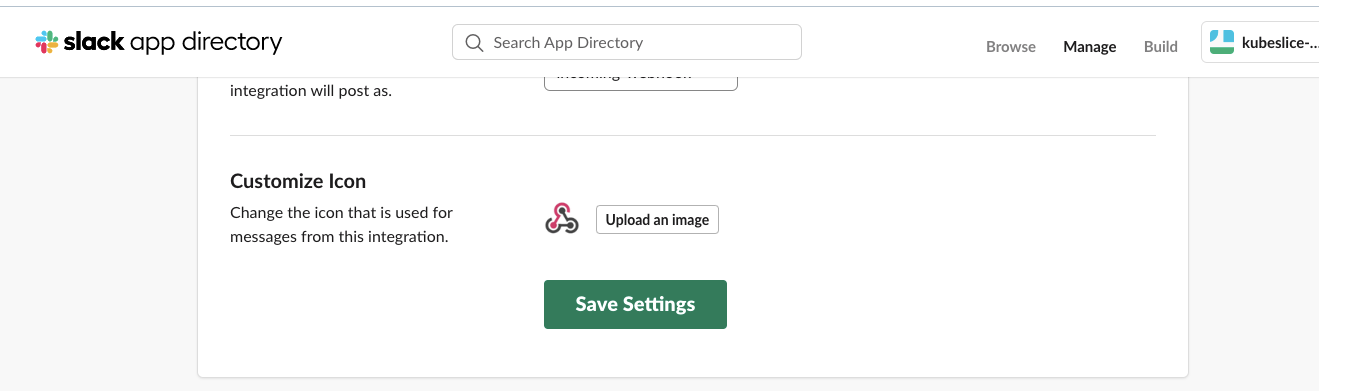
Click Save Settings to save the webhook integration.
-
This step ensures that the necessary
monitoringnamespace is available for Prometheus. Return to the KubeSlice Controller command terminal. If you already have an existingmonitoringnamespace for Prometheus, you can continue with the next step. If themonitoringnamespace does not exist, you need to create it by running the following command:kubectl create ns monitoring -
Use the following command to complete the integration:
(Replace
Slack API URLwith the webhook URL you had copied from the Slack#kubernetes-events-alertschannel.)helm install prometheus kubeslice/prometheus --set alertmanager.enabled=true --set-string alertmanager.config.global.slack_api_url="<Slack-API-URL>" -n <monitoring namespace>
Verify the KubeSlice Alerts Integration with Slack
Verify the running pods in the monitoring namespace using the following command:
kubectl get pods -n <monitoring namespace>
Expected Output
NAME                                             READY   STATUS    RESTARTS   AGE
prometheus-alertmanager-0                        1/1     Running   0          26s
prometheus-kube-state-metrics-7f6bc6c4ff-29kts   1/1     Running   0          27s
prometheus-prometheus-node-exporter-7nmxc        1/1     Running   0          27s
prometheus-prometheus-node-exporter-9bvlk        1/1     Running   0          27s
prometheus-prometheus-node-exporter-rd6tk        1/1     Running   0          27s
prometheus-server-6bf6cb66cd-w6w4r               2/2     Running   0          27s
Configure Prometheus Alert Rules
Prometheus is a powerful real-time series database used for monitoring various components. To effectively monitor and receive alerts when components deviate from expected behavior, it is necessary to configure the corresponding rules on Prometheus. It's important to note that these rules are specifically required for brownfield Prometheus deployments. However, if you are using the Prometheus instance that comes bundled with KubeSlice, these rules are already pre-configured and you can proceed without the need for additional setup.
Slack Metric Alert Support
At present, our support for metric alerts is limited to Slack integration. To configure Prometheus alert rules and receive alerts, it is essential to be a Slack user. Ensure that you have access to a Slack workspace and the necessary permissions to set up and manage alerts. Our alerting system leverages the power of Slack to deliver timely notifications for monitoring and managing your components effectively.
KSM and Custom Resources Metrics
Kube State Metrics (KSM) is a vital service that establishes communication with the Kubernetes API server to gather comprehensive information about various objects, including deployments, pods, and namespaces. It generates metrics following the stable Prometheus format, aligning with the reliability of the Kubernetes API.
In addition to KSM, Custom Resources Metrics play a crucial role in providing specific insights into KubeSlice components such as slices, service exports/imports, Slice Gateway, and more.
To ensure effective monitoring, we have Prometheus alert rules in place that target specific namespaces, including:
- kubeslice-controller
- kubeslice-system
- istio-system
- spire
It's important to note that KubeSlice triggers alerts only when pods are in the ** Failed, Pending, or Unknown** state. This selective approach helps streamline the alerting process, focusing on critical pod states that require immediate attention.
Add the Alert Rules into Prometheus
To install the KSM Metrics and Custom Resource Metrics alert rules in Prometheus:
- Open the Prometheus configuration file.
- Locate the section containing the existing alert rules.
- Add the following alert rules for KSM Metrics under the existing rules section:
Rules for KSM Metrics
The following code snippet contains the rules for KSM metrics.
  - alert: kubeslice component pod status with labels_app
    annotations:
      description: ' Pod {{ $labels.pod }} is {{  $labels.phase }} ,  see the Details
        for more info with labels'
      summary: ' {{ $labels.pod }} Pod went down'
    expr: (sum by (pod,namespace,kubernetes_node,phase,job,instance) (kube_pod_status_phase{namespace=~"^kubeslice.*|spire|istio-system",phase=~"Pending|Unknown|Failed"})>0)+on(instance,pod,kubernetes_node,namespace)group_left(label_app,label_cluster_name)(sum by(pod,namespace,kubernetes_node,label_app,instance,label_cluster_name)(kube_pod_labels{namespace=~"^kubeslice.*|spire|istio-system",label_app=~"app_net_op|nsmgr|admission-webhook-k8s|kubeslice-dns|forwarder-kernel|cert-manager|controller-manager|kubeslice-api-gw|kubeslice-ui-proxy|kubeslice-ui|registry|spire-agent|spire-server|istiod"})>0)
    for: 1m
    labels:
      severity: slack
  - alert: kubeslice operator pod status
    annotations:
      description: ' Pod {{ $labels.pod }} is {{  $labels.phase }} , see the Details
        for more info with labels'
      summary: ' {{ $labels.pod }} Pod went down'
    expr: (sum by(pod,namespace,kubernetes_node,phase,job,instance)(kube_pod_status_phase{namespace=~"^kubeslice.*|spire|istio-system",phase=~"Pending|Unknown|Failed"})>0)+on(instance,pod,kubernetes_node,namespace)group_left(label_spoke_cluster,label_control_plane,label_cluster_name)(sum by(pod, namespace,label_cluster_name,kubernetes_node,label_spoke_cluster,label_control_plane,instance)(kube_pod_labels{namespace=~"^kubeslice.*|spire|istio-system",label_spoke_cluster=~"^w.*|^c.*"})>0)
    for: 1m
    labels:
      severity: slack
  - alert: vl3 pod status
    annotations:
      description: Pod {{ $labels.pod }} is {{  $labels.phase }} , see the Details
        for more info with labels
      summary: '{{ $labels.pod }} Pod went down'
    expr: (sum by(pod,namespace,kubernetes_node,phase,job,instance)(kube_pod_status_phase{namespace=~"^kubeslice.*|spire|istio-system",phase=~"Pending|Unknown|Failed"})>0)+on(instance,pod,kubernetes_node,namespace)group_left(label_networkservicemesh_io_app,label_cluster_name,label_networkservicemesh_io_impl,label_kubeslice_io_slice,label_pod_template_hash)(sum by(pod,namespace,label_cluster_name,kubernetes_node,label_networkservicemesh_io_app,label_networkservicemesh_io_impl,label_kubeslice_io_slice,label_pod_template_hash,instance)(kube_pod_labels{namespace=~"^kubeslice.*|spire|istio-system",pod=~"^vl3-slice-router.*"})>0)
    for: 1m
    labels:
      severity: slack
  - alert: vpn gw pod status
    annotations:
      description: Pod {{ $labels.pod }} is {{  $labels.phase }} , see the Details
        for more info with labels
    expr: (sum by(pod,namespace,kubernetes_node,phase,job,instance)(kube_pod_status_phase{namespace=~"^kube.*|spire|istio-system",phase=~"Pending|Unknown|Failed"})>0)+on(instance,pod,kubernetes_node,namespace)group_left(label_kubeslice_io_slice,label_cluster_name,label_kubeslice_io_slice_gw,label_networkservicemesh_io_app,label_pod_template_hash,label_kubeslice_io_pod_type)(sum by(pod,namespace,kubernetes_node,label_cluster_name,label_kubeslice_io_slice,label_kubeslice_io_slice_gw,label_networkservicemesh_io_app,label_pod_template_hash,label_kubeslice_io_pod_type,instance)(kube_pod_labels{namespace=~"^kubeslice.*|spire|istio-system",pod=~"^b.*|^i.*"})>0)
    for: 1m
    labels:
      severity: slack
Rules for Custom Resource Metrics
The following code snippet contains the rules for custom resources metrics.
      - alert: kubeslice cluster health
        annotations:
          description: kubeslice cluster {{ $labels.slice_cluster }} is not up for project {{  $labels.slice_project }}, see the Details for more info with labels
        expr: kubeslice_cluster_up < 0
        for: 1m
        labels:
          severity: slack
      - alert: kubeslice cluster component health
        annotations:
          description: cluster component {{ $labels.slice_cluster_component }} is unhealthy for project {{  $labels.slice_project }} on cluster {{ $labels.slice_cluster }}, see the Details for more info with labels
        expr: kubeslice_cluster_component_up < 0
        for: 1m
        labels:
          severity: slack
      - alert: kubeslice slice health
        annotations:
          description: slice component {{ $labels.slice }} is unhealthy for project {{  $labels.slice_project }} on cluster {{ $labels.slice_cluster }}, see the Details for more info with labels
        expr: kubeslice_slice_up < 0
        for: 1m
        labels:
          severity: slack
      - alert: kubeslice slice component health
        annotations:
          description: slice component {{ $labels.slice_component }} is unhealthy for project {{  $labels.slice_project }} on cluster {{ $labels.slice_cluster }}, see the Details for more info with labels
        expr: kubeslice_slice_component_up < 0
        for: 1m
        labels:
          severity: slack
      - alert: kubeslice app pod details
        annotations:
          description: No app pod is active on slice {{ $labels.slice }} for project {{  $labels.slice_project }} at cluster {{ $labels.slice_cluster }}, see the Details for more info with labels
        expr: kubeslice_app_pods < 0
        for: 1m
        labels:
          severity: slack
      - alert: kubeslice service export endpoints
        annotations:
          description: for project {{ $labels.slice_project }} no service export endpoints is active on slice {{ $labels.slice }} in namespace {{  $labels.slice_namespace }}, see the Details for more info with labels
        expr: kubeslice_serviceexport_endpoints < 0
        for: 1m
        labels:
          severity: slack
      - alert: kubeslice service import endpoints
        annotations:
          description: for project {{ $labels.slice_project }} no service  import endpoints is active on slice {{ $labels.slice }} in namespace {{  $labels.slice_namespace }}, see the Details for more info with labels
        expr: kubeslice_serviceimport_endpoints < 0
        for: 1m
        labels:
          severity: slack
      - alert: kubeslice netpol validation
        annotations:
          description: netpol voilation is not active for project {{ $labels.slice_project }} on cluster {{ $labels.slice_cluster }} and the slice reporting controller is {{ $labels.slice_reporting_controller }}, see the Details for more info with labels
        expr: kubeslice_netpol_violations_active < 0
        for: 1m
        labels:
          severity: slack
      - alert: kubeslice slice gateway tunnel validation
        annotations:
          description: no vpn tunnel is active for project {{ $labels.slice_project }} on cluster {{ $labels.slice_cluster }} and the slice reporting controller is {{ $labels.slice_reporting_controller }}, see the Details for more info with labels
        expr: kubeslice_slicegateway_tunnel_up < 0
        for: 1m
        labels:
          severity: slack
-
Add the KSM and custom metrics alert rules into the Prometheus configuration. The updated configuration with alert rules should look as the file below.
groups:
    - name: kubeslice component status
      rules:
      - alert: kubeslice component pod status with labels_app
        annotations:
          description: ' Pod {{ $labels.pod }} is {{  $labels.phase }} ,  see the Details
            for more info with labels'
          summary: ' {{ $labels.pod }} Pod went down'
        expr: (sum by (pod,namespace,kubernetes_node,phase,job,instance) (kube_pod_status_phase{namespace=~"^kubeslice.*|spire|istio-system",phase=~"Pending|Unknown|Failed"})>0)+on(instance,pod,kubernetes_node,namespace)group_left(label_app,label_cluster_name)(sum by(pod,namespace,kubernetes_node,label_app,instance,label_cluster_name)(kube_pod_labels{namespace=~"^kubeslice.*|spire|istio-system",label_app=~"app_net_op|nsmgr|admission-webhook-k8s|kubeslice-dns|forwarder-kernel|cert-manager|controller-manager|kubeslice-api-gw|kubeslice-ui-proxy|kubeslice-ui|registry|spire-agent|spire-server|istiod"})>0)
        for: 1m
        labels:
          severity: slack
      - alert: kubeslice operator pod status
        annotations:
          description: ' Pod {{ $labels.pod }} is {{  $labels.phase }} , see the Details
            for more info with labels'
          summary: ' {{ $labels.pod }} Pod went down'
        expr: (sum by(pod,namespace,kubernetes_node,phase,job,instance)(kube_pod_status_phase{namespace=~"^kubeslice.*|spire|istio-system",phase=~"Pending|Unknown|Failed"})>0)+on(instance,pod,kubernetes_node,namespace)group_left(label_spoke_cluster,label_control_plane,label_cluster_name)(sum by(pod, namespace,label_cluster_name,kubernetes_node,label_spoke_cluster,label_control_plane,instance)(kube_pod_labels{namespace=~"^kubeslice.*|spire|istio-system",label_spoke_cluster=~"^w.*|^c.*"})>0)
        for: 1m
        labels:
          severity: slack
      - alert: vl3 pod status
        annotations:
          description: Pod {{ $labels.pod }} is {{  $labels.phase }} , see the Details
            for more info with labels
          summary: '{{ $labels.pod }} Pod went down'
        expr: (sum by(pod,namespace,kubernetes_node,phase,job,instance)(kube_pod_status_phase{namespace=~"^kubeslice.*|spire|istio-system",phase=~"Pending|Unknown|Failed"})>0)+on(instance,pod,kubernetes_node,namespace)group_left(label_networkservicemesh_io_app,label_cluster_name,label_networkservicemesh_io_impl,label_kubeslice_io_slice,label_pod_template_hash)(sum by(pod,namespace,label_cluster_name,kubernetes_node,label_networkservicemesh_io_app,label_networkservicemesh_io_impl,label_kubeslice_io_slice,label_pod_template_hash,instance)(kube_pod_labels{namespace=~"^kubeslice.*|spire|istio-system",pod=~"^vl3-slice-router.*"})>0)
        for: 1m
        labels:
          severity: slack
      - alert: vpn gw pod status
        annotations:
          description: Pod {{ $labels.pod }} is {{  $labels.phase }} , see the Details
            for more info with labels
        expr: (sum by(pod,namespace,kubernetes_node,phase,job,instance)(kube_pod_status_phase{namespace=~"^kube.*|spire|istio-system",phase=~"Pending|Unknown|Failed"})>0)+on(instance,pod,kubernetes_node,namespace)group_left(label_kubeslice_io_slice,label_cluster_name,label_kubeslice_io_slice_gw,label_networkservicemesh_io_app,label_pod_template_hash,label_kubeslice_io_pod_type)(sum by(pod,namespace,kubernetes_node,label_cluster_name,label_kubeslice_io_slice,label_kubeslice_io_slice_gw,label_networkservicemesh_io_app,label_pod_template_hash,label_kubeslice_io_pod_type,instance)(kube_pod_labels{namespace=~"^kubeslice.*|spire|istio-system",pod=~"^b.*|^i.*"})>0)
        for: 1m
        labels:
          severity: slack
      - alert: kubeslice cluster health
        annotations:
          description: kubeslice cluster {{ $labels.slice_cluster }} is not up for project {{  $labels.slice_project }}, see the Details for more info with labels
        expr: kubeslice_cluster_up < 0
        for: 1m
        labels:
          severity: slack
      - alert: kubeslice cluster component health
        annotations:
          description: cluster component {{ $labels.slice_cluster_component }} is unhealthy for project {{  $labels.slice_project }} on cluster {{ $labels.slice_cluster }}, see the Details for more info with labels
        expr: kubeslice_cluster_component_up < 0
        for: 1m
        labels:
          severity: slack
      - alert: kubeslice slice health
        annotations:
          description: slice component {{ $labels.slice }} is unhealthy for project {{  $labels.slice_project }} on cluster {{ $labels.slice_cluster }}, see the Details for more info with labels
        expr: kubeslice_slice_up < 0
        for: 1m
        labels:
          severity: slack
      - alert: kubeslice slice component health
        annotations:
          description: slice component {{ $labels.slice_component }} is unhealthy for project {{  $labels.slice_project }} on cluster {{ $labels.slice_cluster }}, see the Details for more info with labels
        expr: kubeslice_slice_component_up < 0
        for: 1m
        labels:
          severity: slack
      - alert: kubeslice app pod details
        annotations:
          description: No app pod is active on slice {{ $labels.slice }} for project {{  $labels.slice_project }} at cluster {{ $labels.slice_cluster }}, see the Details for more info with labels
        expr: kubeslice_app_pods < 0
        for: 1m
        labels:
          severity: slack
      - alert: kubeslice service export endpoints
        annotations:
          description: for project {{ $labels.slice_project }} no service export endpoints is active on slice {{ $labels.slice }} in namespace {{  $labels.slice_namespace }}, see the Details for more info with labels
        expr: kubeslice_serviceexport_endpoints < 0
        for: 1m
        labels:
          severity: slack
      - alert: kubeslice service import endpoints
        annotations:
          description: for project {{ $labels.slice_project }} no service  import endpoints is active on slice {{ $labels.slice }} in namespace {{  $labels.slice_namespace }}, see the Details for more info with labels
        expr: kubeslice_serviceimport_endpoints < 0
        for: 1m
        labels:
          severity: slack
      - alert: kubeslice netpol validation
        annotations:
          description: netpol voilation is not active for project {{ $labels.slice_project }} on cluster {{ $labels.slice_cluster }} and the slice reporting controller is {{ $labels.slice_reporting_controller }}, see the Details for more info with labels
        expr: kubeslice_netpol_violations_active < 0
        for: 1m
        labels:
          severity: slack
      - alert: kubeslice slice gateway tunnel validation
        annotations:
          description: no vpn tunnel is active for project {{ $labels.slice_project }} on cluster {{ $labels.slice_cluster }} and the slice reporting controller is {{ $labels.slice_reporting_controller }}, see the Details for more info with labels
        expr: kubeslice_slicegateway_tunnel_up < 0
        for: 1m
        labels:
severity: slack -
To upgrade Prometheus, you can use the following command:
helm upgrade prometheus kubeslice/prometheus --set alertmanager.enabled=true --set-string alertmanager.config.global.slack_api_url="<Slack API URL>" -n <monitoring_namespace>
Make sure to replace <Slack API URL> with the actual URL of your Slack API and <monitoring_namespace> with the desired namespace for Prometheus.
For instructions on how to get the Slack API URL (also known as webhook URL), see Configure Alerts integration.
Congratulations! You have successfully configured the alert rules to monitor KubeSlice. Now, whenever there is an event that requires attention, Prometheus will send alerts through Slack. Stay informed and keep an eye on the monitoring alerts to ensure the smooth operation of KubeSlice.


